> ## Documentation Index
> Fetch the complete documentation index at: https://docs.convocore.ai/llms.txt
> Use this file to discover all available pages before exploring further.
# Analytics
> A comprehensive overview of user interactions and performance metrics for your AI agent.
## Overview
The Analytics page provides a variety of metrics to help you understand user interactions with your AI agent. From monthly interaction counts to detailed retention charts, this page equips you with the tools to assess your agent’s effectiveness and make informed, data-driven decisions.
***
## Key Features
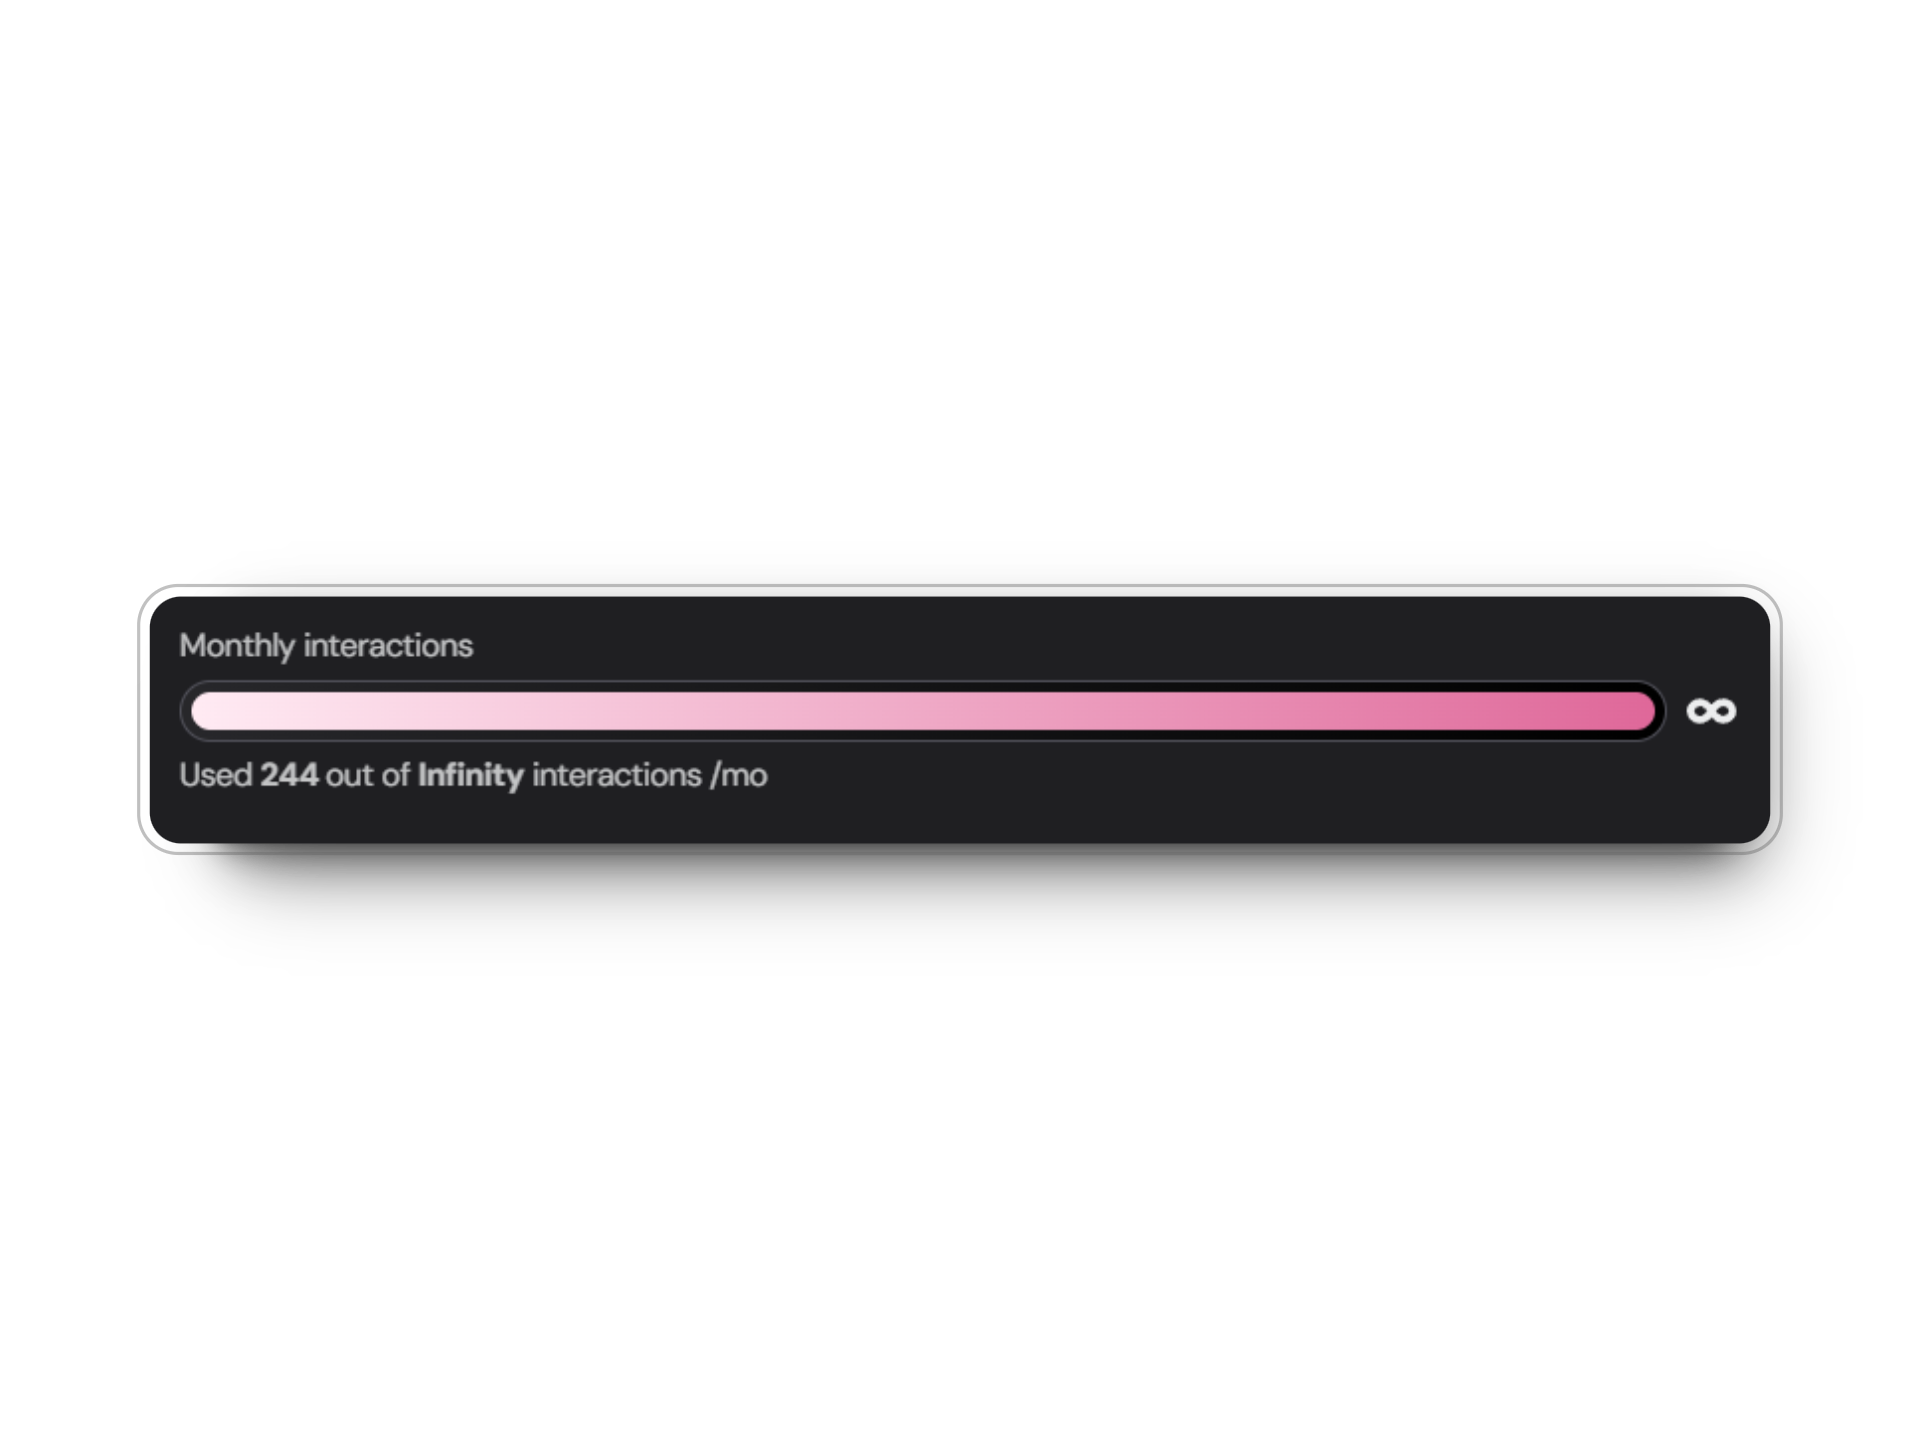
### 1. **Interactions**
This metric shows the total number of user interactions your chatbot has handled within the selected time range, helping you track growth in usage.
* Displays total interactions and conversations handled by the chatbot.
* Includes insights on average messages per chat and time spent per chat.
### 2. **Top Intents**
Track the number of interactions your agent handles over time.
 Custom limits can be set in the agent settings tab.
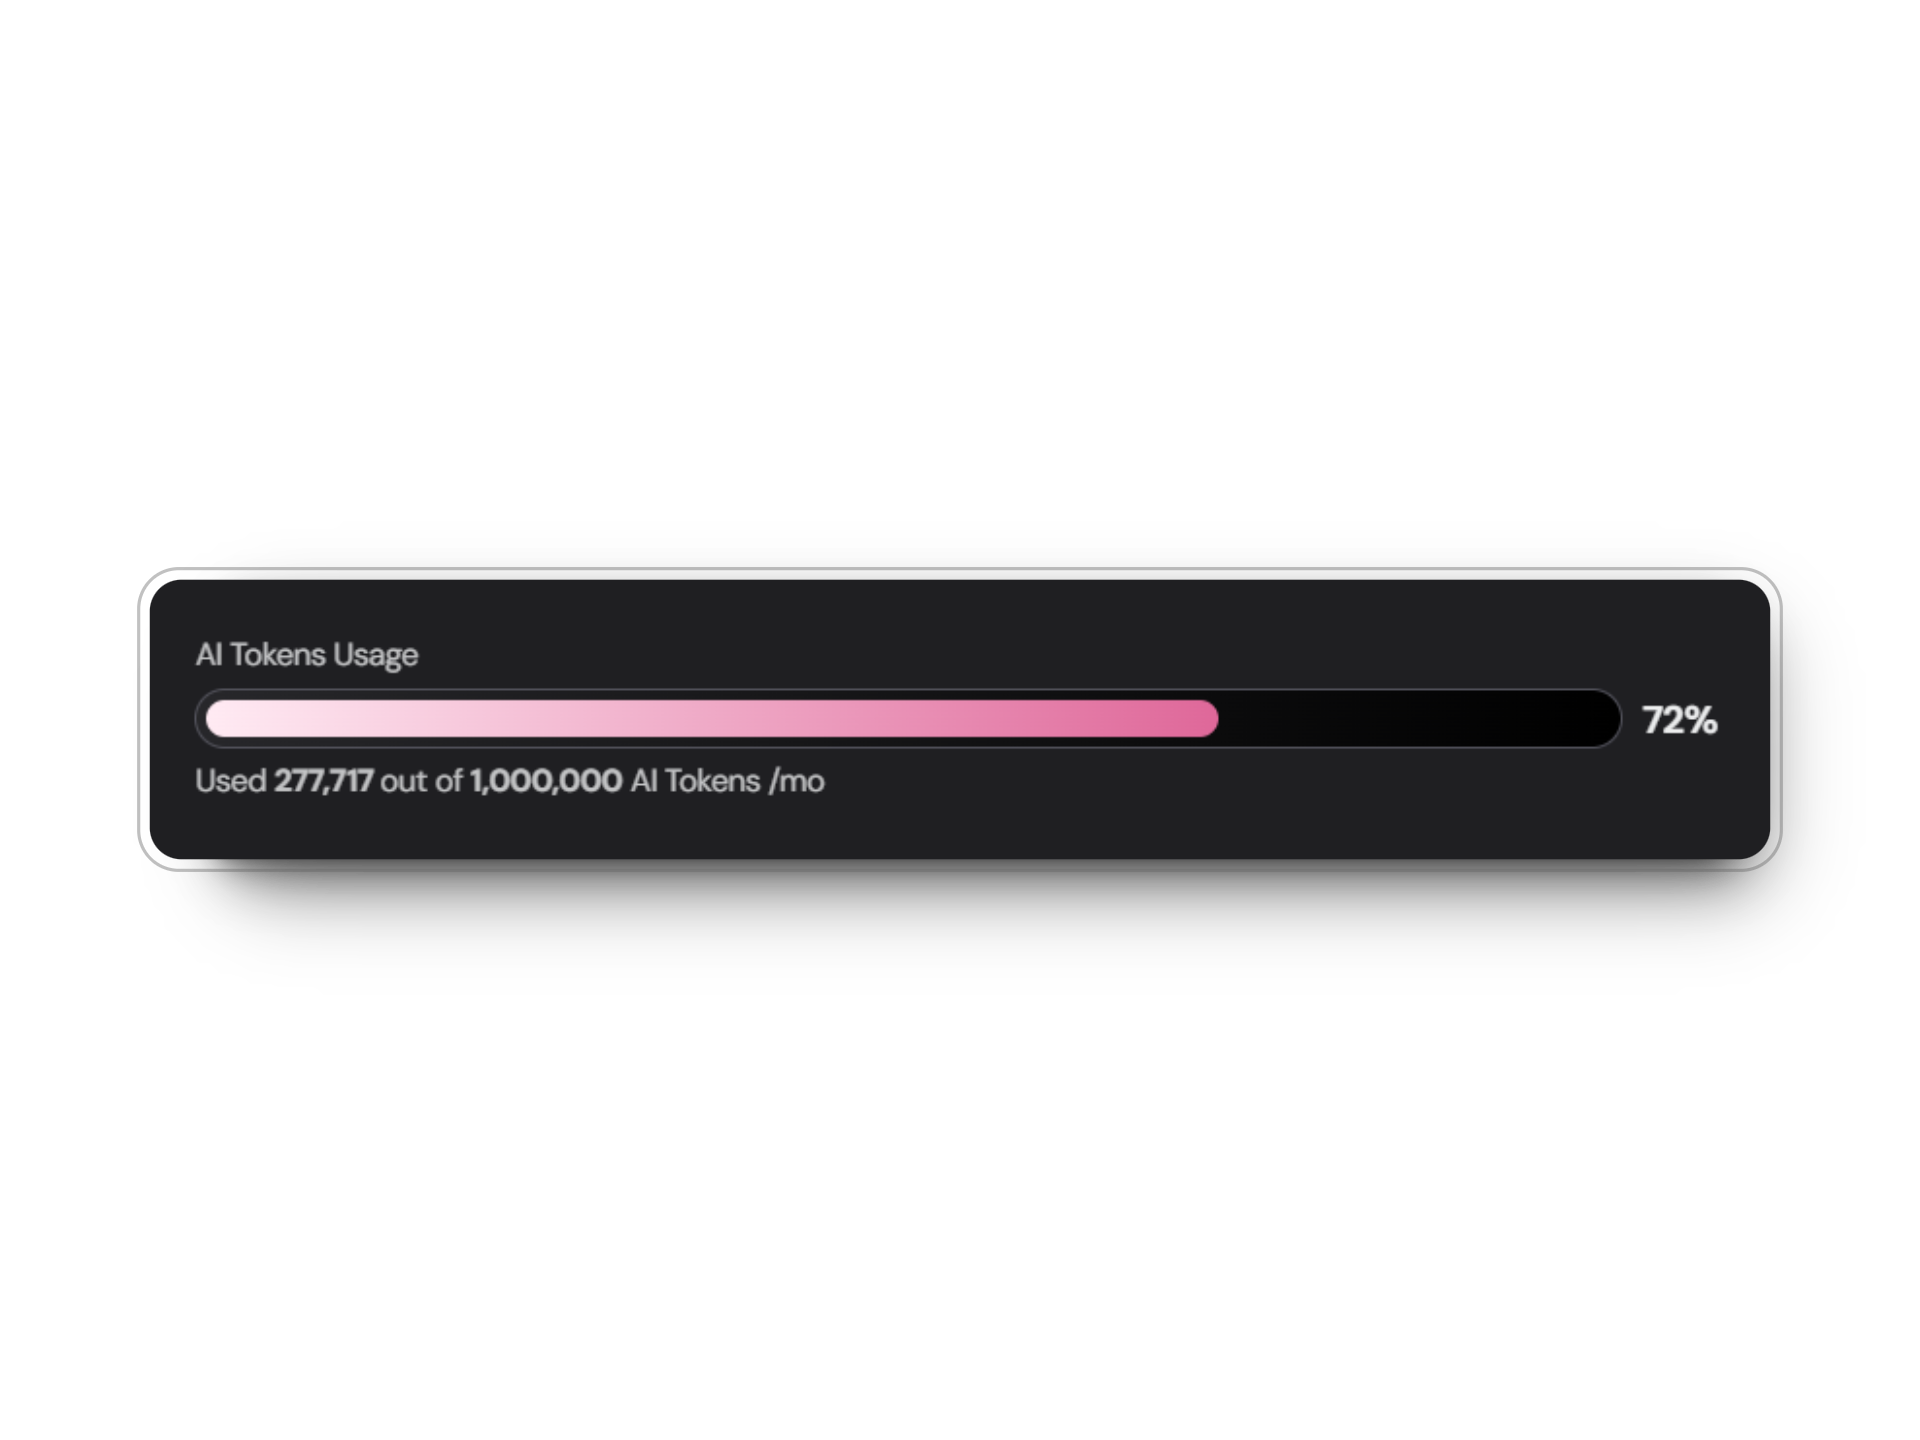
Monitor AI token consumption to optimize costs and performance.
Custom limits can be set in the agent settings tab.
Monitor AI token consumption to optimize costs and performance.
 Custom limits can be set in the agent settings tab.
Track the number of distinct users initiating conversations with your agent.
View the cumulative number of interactions over time.
Understand the average length and depth of conversations with your agent.
Measure your agent's efficiency by tracking the average duration of interactions.
The **total interactions** and **total conversations** are displayed as key metrics at the top of the Analytics tab and as graphs based on your selected time range.
### 3. **Understood Messages**
A pie chart visualizes the percentage of messages understood by your agent.
* Green and red sections of the chart highlight successful versus misunderstood messages.
### 4. **Total Conversations**
This metric indicates the total number of conversations your agent has had across all platforms.
### 5. **User Retention**
User retention tracks how many interactions users have before leaving the conversation.
* The graph shows the percentage of users retained across different interaction counts, helping identify where users drop off.
### 6. **Time Retention**
This metric shows how long users stay engaged with the chatbot during conversations. Higher retention indicates better engagement.
* Measured in seconds, it represents engagement duration across the user base.
***
## Visual Representation
Add the following visual aids to the documentation:
* **Monthly Interactions**: Embed a bar graph screenshot to illustrate how interactions are represented.
* **Retention Metrics**: Include retention graphs for both user and time retention to explain trends.
* **Top Intents**: Add a pie chart visualization for intents to provide a clear picture of chatbot use cases.
Ensure your agent’s intents are well-defined and aligned with user needs to maintain high message understanding.
***
## Best Practices
Regularly review your agent's analytics to spot trends, identify areas for improvement, and ensure the bot meets user expectations effectively.
***
## Conclusion
The Analytics page is a powerful tool for monitoring your AI chatbot's performance. By leveraging the metrics and insights provided, you can continuously refine your bot and ensure a high-quality user experience.
Custom limits can be set in the agent settings tab.
Track the number of distinct users initiating conversations with your agent.
View the cumulative number of interactions over time.
Understand the average length and depth of conversations with your agent.
Measure your agent's efficiency by tracking the average duration of interactions.
The **total interactions** and **total conversations** are displayed as key metrics at the top of the Analytics tab and as graphs based on your selected time range.
### 3. **Understood Messages**
A pie chart visualizes the percentage of messages understood by your agent.
* Green and red sections of the chart highlight successful versus misunderstood messages.
### 4. **Total Conversations**
This metric indicates the total number of conversations your agent has had across all platforms.
### 5. **User Retention**
User retention tracks how many interactions users have before leaving the conversation.
* The graph shows the percentage of users retained across different interaction counts, helping identify where users drop off.
### 6. **Time Retention**
This metric shows how long users stay engaged with the chatbot during conversations. Higher retention indicates better engagement.
* Measured in seconds, it represents engagement duration across the user base.
***
## Visual Representation
Add the following visual aids to the documentation:
* **Monthly Interactions**: Embed a bar graph screenshot to illustrate how interactions are represented.
* **Retention Metrics**: Include retention graphs for both user and time retention to explain trends.
* **Top Intents**: Add a pie chart visualization for intents to provide a clear picture of chatbot use cases.
Ensure your agent’s intents are well-defined and aligned with user needs to maintain high message understanding.
***
## Best Practices
Regularly review your agent's analytics to spot trends, identify areas for improvement, and ensure the bot meets user expectations effectively.
***
## Conclusion
The Analytics page is a powerful tool for monitoring your AI chatbot's performance. By leveraging the metrics and insights provided, you can continuously refine your bot and ensure a high-quality user experience.